
by Philip Wu
In our previous blog article, we discussed the activities of our Owl Bundle on Thinkorswim group, a community of experienced traders who gather weekly to jointly learn to effectively use the Owl Bundle on Thinkorswim tools supporting Dr. Ken Long's trading techniques. In the past three weeks, our focus has been on studying the Thinkscript language and this article is an update on the new applications we have developed for "finding the movers."
To provide some background, the Thinkscript language offers customization options in five different areas of the Thinkorswim platform: 1) Filters for the watchlist columns, 2) Indicator studies, 3) Backtesting strategies, 4) Scans and Alerts, and 5) Conditional orders based on technical studies. In this blog article, we will highlight a few examples to illustrate these applications.

Thinkscript code is used to customize 5 areas in the Thinkorswim platform
Our first exercise involved creating a new watchlist column aimed at identifying symbols exhibiting abnormal conditions and ready to move. Drawing from our Applied Systems Development course, we coded in Thinkscript the Zscore of the slope of the 30-period regression line as a technique for detecting abnormal states. We coded a watchlist column to display the Zscore slopes for symbols in our watchlist. The green-shaded cells highlight six symbols with Zscores greater than one standard deviation above normal.

Example 1: Zscore of the RL30 slopes across the watchlist of symbols
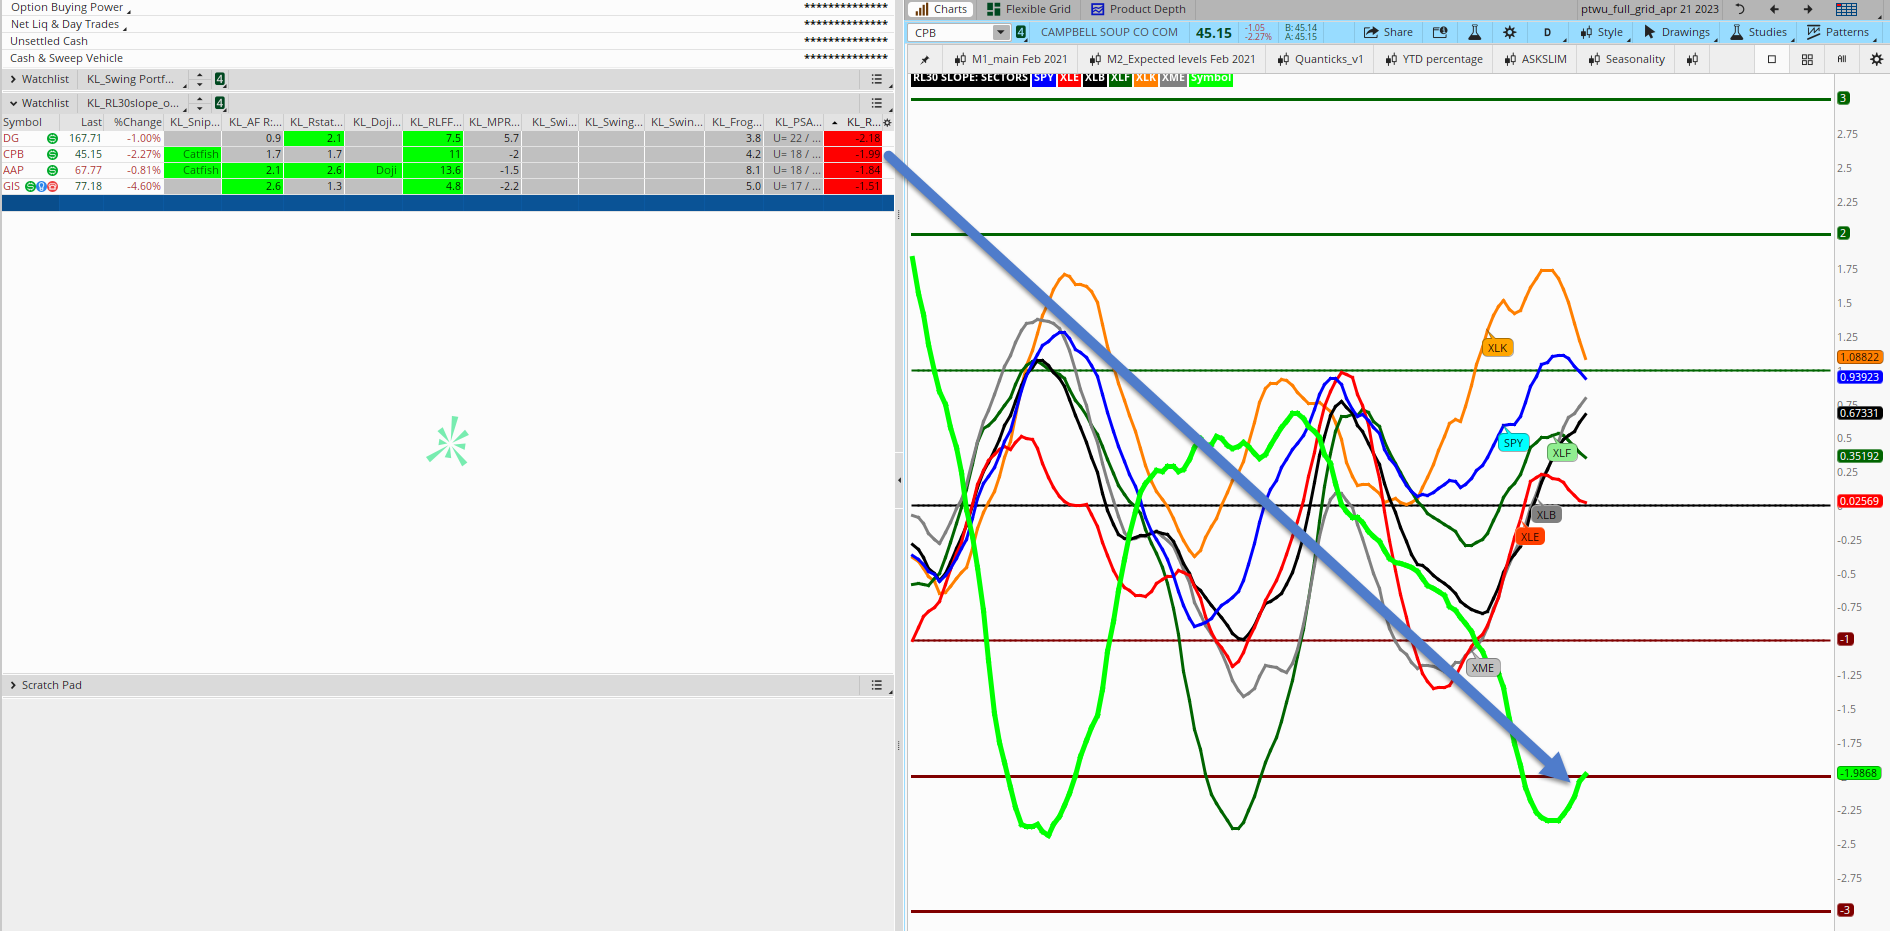
For a second use case example, we coded a Thinkscript scan to identify symbols that were more than 1.5 standard deviations below the norm and beginning to reverse directions. This scan aims to identify oversold symbols that are likely to revert back to their mean, presenting a potential long entry opportunity. As shown in th figure below, the scan identified AAP, CPB, DG, and GIS as symbols more than 1.5 standard deviations below their respective means and starting to reverse in direction.

Example 2: Scan results showing CPB nearing 2 standard deviations below the norm and starting to rise
As an example, the figure below shows CPB as being close to 2 standard deviations below the norm and beginning its upward movement.
For a third application of Thinkscript, we coded an order entry that would trigger an exit from a long entry if the ten-period regression line RL10 crossed below the PSAR study.

Example 3: Conditional order based on the crossing of RL10 and PSAR studies
For future meetings, we plan to explore further conditional orders based on technical studies, aiming to enhance our trading efficiency.
These examples highlight just a few of the studies that our Owl Bundle on Thinkorswim user group explores on a weekly basis, constantly striving to improve our trading knowledge and efficiency. If you have an interest in joining our user group, please contact us at ablewaytech@gmail.com.
Happy Trading !