
15 years of data across 7 global ETFs reveal where mean reversion thrives and momentum fails.
The Quest for Alpha, One Heatmap at a Time
At AbleWayTech, we believe great trading isn’t the result of luck — it’s built on data, structure, and edge awareness. That philosophy was front and center in our latest Owl Bundle User Group (OBUG) Meeting 111, where we revealed the results of our deep-dive study on regional ETF market behavior using 15-year backtests with EdgeRater.
This wasn’t just another indicator study — it was a multi-regime, multi-horizon quantitative analysis of global equity markets using the RL30Slope Z-score, an advanced price slope momentum indicator developed by Dr. Ken Long to quantify trend acceleration and regime shifts with statistical precision.
Study Objective: Where is the Edge?
The core question behind our research: Which market regimes offer the greatest edge for swing trading across regions? We applied this question to seven major ETFs representing global equity regions — including the U.S. as a reference benchmark:
EFA – Developed Markets ex-US
IEV – Europe
EWJ – Japan
EPP – Asia Pacific ex-Japan
ILF – Latin America
EEM – Emerging Markets
SPY – U.S. (as a comparative baseline)
Each ETF was analyzed using:
RL30Slope Z-scores at entry (from +3 to -3 sigmas)
Holding periods: 3, 5, 10, and 15 days
FE50 outcomes (Final Equity / Starting Equity at the 50th percentile)
Figure 1.0 below is an example of the Heatmap analysis for ILF the Latin America ETF:
Z < -2.0 → Strong mean reversion signals; price often rebounds sharply
Z = +0.5 to +1.5 → Continuation trades fueled by institutional momentum
Z between -1.5 and 0.0 → Low-conviction zones; prone to sideways chop (red box)
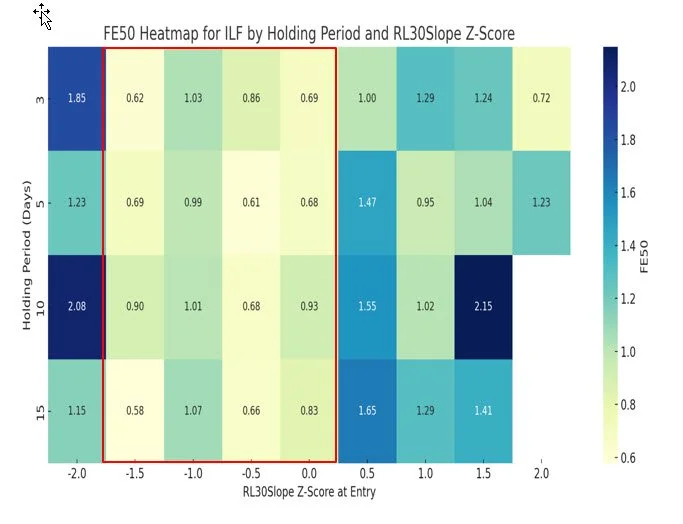
Figure 1: RL30Slope Zscore Analysis on ILF - Latin Americal ETF
We analyzed all 7 regional ETFs in this manner with results shown in Figure 2.

Figure 2: RL30Slope Zscores on SPY, EFA, ILF, EWJ, IEV, EPP, EEM
Key Takeaways: Where Alpha Lives
Z = -2.0 to -1.5 sigmas is the universal sweet spot
This zone represents deeply oversold conditions followed by slope reversal — ideal for mean reversion swing trades with high expectancy.
Z = +1.5 is your momentum breakout zone
Strong upward slopes + institutional follow-through = continuation setups that favor trend trades.
Trap Zones (-1 < Z < +1)
Price lacks conviction. These are the “drift zones” — low expectancy, high noise. Great for tourist traders. Not for us.
Global Macro Implications
Certain ETFs behaved differently based on macro capital flows:
EEM and EPP weren’t momentum-driven.
These instruments react best to panic-buying reversals, not strength chasing.
This underscores a key insight:
“Not all instruments respond the same way to the same signals.”
Portfolio Optimization in Action
This Z-score matrix allows traders to:
Avoid low-expectancy trade zones
Allocate capital by regime and conviction
Tailor holding periods to volatility conditions
Use data-driven filters to deploy trades with greater precision
This is not just technical analysis — it’s edge-aware, regime-adaptive trading
Join the Owl Bundle User Group (OBUG)
If this level of rigor, insight, and collaboration excites you — don’t trade alone. Join the Owl Bundle User Group (OBUG) traders gather to build:
Robust systems based on statistical backtests
Backtested frameworks designed for risk-adjusted returns
Non-correlated strategies for smoother portfolio equity curves
Join us today at www.ablewaytech.com/obug
Disclosures: All OBUG materials are for educational purposes only. This is not investment advice. See full disclaimer at the bottom of this page.